What We Do
Creative intelligence. Media intelligence.One brain.
Two products for the people who make the work. Three products for the people who place it. Every product answers a different dimension of the same question: what does this creative do to the brain?
Two brain scans.One diagnostic verdict.
The pre-launch replacement for in-market A/B testing. Upload two versions of the same creative. Each receives a complete, independent neural profile. The comparison gives you a diagnostic verdict — naming the version that produces a stronger and more durable cortical response — before you spend a dollar on impressions.
Media buyers choosing which version to put budget behind. Account directors settling internal creative debates. Anyone who would otherwise run a Meta or Google Ads split test to find the answer.
Upload two versionsNeural Verdict
Version B wins — stronger limbic engagement, delayed habituation
3× / week
Frequency cap
28 days
Lifespan
Upper 25%
Quartile
The complete media brief.From neural data, not guesswork.
The neural profile tells you what the brain does with your creative. The Media Intelligence Report translates that into the four numbers a media planner needs before a campaign goes live: where to place it, how often to serve it, for how many days, and what to test next.
Media planners building channel plans before launch. Performance marketers setting frequency caps and rotation schedules. Heads of Digital deciding kill-or-scale.
Get the media briefWhat does the brain dowhen it sees this layout?
A static image contains a product, a price, a brand signal, a colour field, and a typographic hierarchy. The brain processes all of them simultaneously in the first two seconds. Creative Scan: Image tells you which element is driving the cortical response and exactly when the brain disengages.
Creative directors reviewing a layout before production budget is committed. Account directors who want a neural scan alongside the creative rationale in a client presentation.
Upload an imageNeural Response · Left Hemisphere
t=0s → t=4s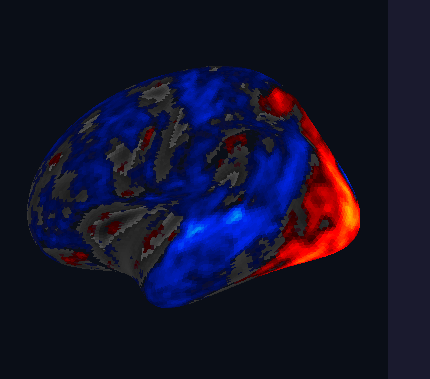
t=0s
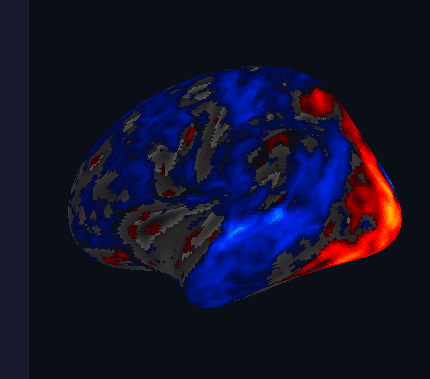
t=1s
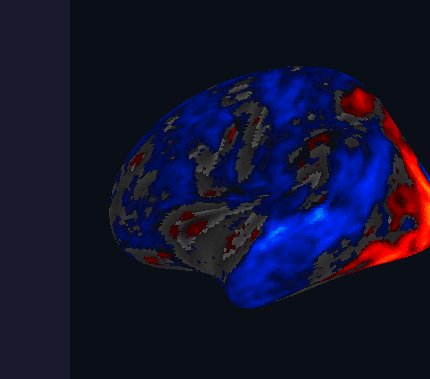
t=2s
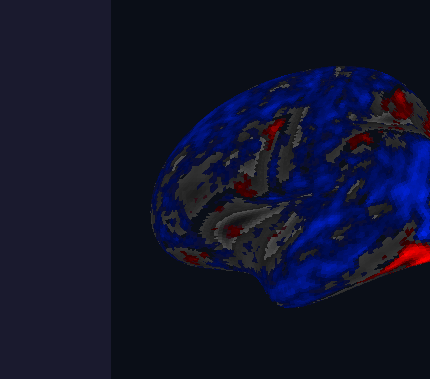
t=3s
t=4s
Predicted cortical response · 7 networks · z-scored against the addBrains baseline
Network Activation
| Network | Mean (z) | Trend |
|---|---|---|
| Frontoparietal | −0.021 | decay |
| Default mode | −0.023 | decay |
| Limbic | −0.026 | stable |
| Ventral att. | −0.036 | drop |
| Somatomotor | −0.039 | decay |
| Visual cortex | −0.042 | rising |
| Dorsal att. | −0.043 | stable |
Emotional peak
t=8s
Drop-off
t=14s
Min. exposure
9s
The exact second the brainresponds to your video.
The limbic system does not peak at the opening frame. It peaks when the story lands. Creative Scan: Video finds that exact timestep. If your placement doesn’t buy enough time to reach it, you’re paying for the setup and discarding the payload.
Video creative directors before production lock. Media planners choosing between skippable and non-skippable formats. Brand managers confirming the placement buys enough time for the story to land.
Upload a videoWhen does this creativeneurologically expire?
The industry runs on creative rotation schedules built from gut instinct and CTR drops. By the time fatigue shows up in performance data, the spend is already wasted. Fatigue Forecast tells you the expiry date before the campaign launches — with a specific frequency cap, a lifespan in days, and the one compositional pattern accelerating the decay.
Performance marketers managing always-on campaigns. Media planners building rotation schedules. Anyone managing creative across a multi-week or multi-month campaign flight.
Get the forecast◈ Extension recommendation
Remove secondary currency denomination. Projected lifespan: 24–28 days.
The brain doesn’t negotiate.Your data is waiting.
Upload your first creative. See what the brain does with it.